The Trouble with Static Slides
As marketing researchers, we know how challenging it can be to communicate marketing research insights, perhaps feeling this pain more acutely than any other function within the enterprise. While we no longer have to create paper reports (which only touched the beginning of my career in research), even using a medium like PowerPoint requires the researcher to tell their story using either mundane text, tables and graphs, or invest the time in creating image-based infographics and diagrams that demand both artistry and a knowledge of statistics, at the cost of time and the related expense.
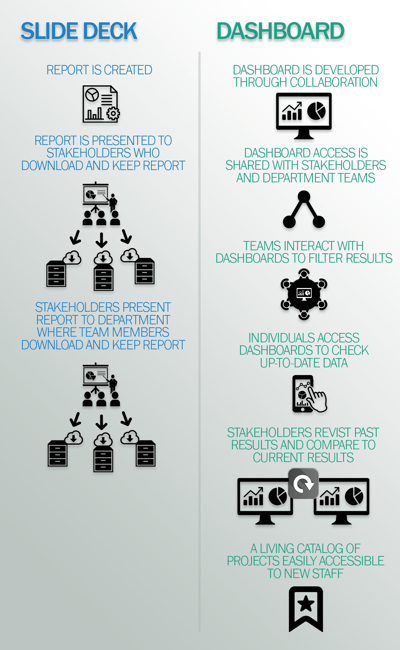
Beyond their initial creation, slide decks also pose complications when it comes to sharing insights, as they rely on how effectively the information is distributed company-wide. If you consider the common distribution practice of research reports, it’s easy to see how the report is treated similarly to a library book; it is checked out, copied, reviewed, referenced, but always requires someone to take it off the shelf and someone to remember that it’s waiting on that shelf to be read again. Granted, the shelf is now electronic, and the copying and referencing are done via applications and file-sharing websites, but even so, the data and insights remain locked in a format that offers a poor forum for content-based discussion. The process of ‘download and keep’ is just that; a download and a static residence in the e-file cabinet.
Stored reports, even well-labeled ones that go into knowledge databases, get forgotten. All too often, I receive calls from clients who are looking to conduct research and are unfamiliar with similar research performed at their company even a year earlier. While this can be the result of staff turnover or promotion, it comes down to a lack of communication and a difficulty to access previous studies.
For some industries, year-old studies represent very stale data; for most companies, however, primary research insights, especially foundational work in determining core needs, segmentations, voice of the customer, and discrete choice/conjoint studies, have much longer useful lives within an organization, but just get buried in a file system. In order to keep your insights actionable, you first need to keep them alive. And there is a solution.
Dashboards – The Defibrillator Your Insights Need
If you want your marketing research insights to live, to promote interaction and to ultimately be actionable, you must ensure they are accessible (we will address the interactive nature of dashboards and their unique ability to make your hard-earned insights actionable in upcoming blogs). A migration from static PowerPoint decks to online dashboards allow you to do just that.
The word dashboard isn’t necessarily the best descriptor of these living, breathing online locations for sharing market research insights. While the term is appropriate in representing the visual format in which dashboards indicate your current state (speed, engine output, oil reserves, etc.) and keep the information ‘heads-up’ in front of you, it fails to cover the interactive nature of the dashboards and their use as an analysis tool.
Dashboards offer online access to your data, which means insights are virtually available anywhere, at any time and from any device. You no longer have to worry about email attachment sizes and download access. This kind of accessibility promotes greater participation from stakeholders and other team members. That participation encourages the continued utilization of insights in sales, marketing and R&D efforts.
Live on the website, the story of your data and the resulting insights becomes visually compelling. Through the use of infographics, you’ll be able to see the pertinent information at a glance. More importantly though, the tools used for Dashboarding now cut down on the development time of researchers, allowing you faster access to your data and savings on report preparation expenses.
In the end, we need marketing insights that are actionable, those that meet the goals and objectives of the research we commission, and position us to make informed, thoughtful decisions about our products and our direction. The key to ensuring your research is actionable, is making sure it’s both alive and dynamic, that is, accessible and interactive.
Keep an Eye Out for More
Dynamic interactivity is one of the primary benefits of using dashboards to disseminate marketing research results. Actionable Research is, over the next quarter, devoting our blog to the topic of dashboarding results, focusing next of their interactivity. We are making a commitment to ensuring our insight reporting is alive and healthy through the introduction of EverStream™ Reporter, which will be an integral part of our custom and Insight Streamer research studies. Please subscribe to our blog to be updated as we discuss the many benefits of dashboarding and the opportunities available through the proper distribution and delivery of primary market research insights.