
Conjoint analysis studies have become more and more powerful since they have been available for delivery online, with Adaptive Choice-Based Conjoint (ACBC) analysis being “state of the art”, meaning the latest in a time tested (10 years) methodology. Regular choice-based conjoint (CBC) analysis is excellent when the number of attributes and levels is relatively small (6-8 levels, 12 or less choice tasks), however, these conjoint analysis matrix sizes aren’t realistic for a true look at a product such as a medical device, an application for delivering a service online, or even many consumer technology products.
A solution to this is an adaptive conjoint analysis. In conjoint analysis, “adaptive” means the design of the choice tasks are customized to the respondent based on which attributes they use for their product preference decisions. Since adapting an exercise for a particular respondent is a function of knowing which attributes and/or levels to leave out of the final set of configurations you share with a respondent, it is not useful to simply ask a respondent which attributes they would use in their decision.
The ACBC conjoint analysis uses a natural method to determine which attributes or levels of attributes are being used as rules for deciding whether or not a configuration will work. Here is the interview flow:
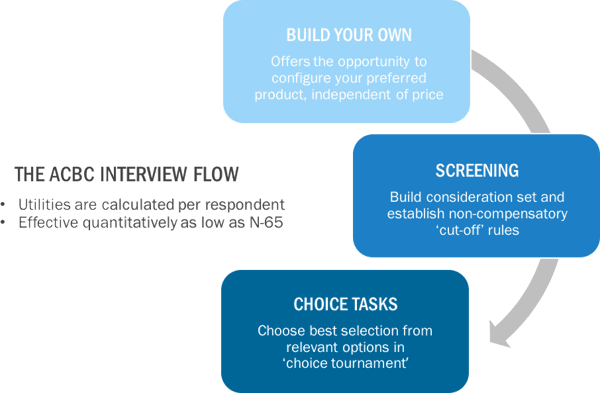
Build your own: Initially, the respondent is asked to select options that reflect their favorite configuration of the concept, independent of pricing. BYO enables the respondent to thoroughly review choices and exclude attributes, if desired. Individualized pricing can be displayed for specific attributes or levels.
Screening Tasks: Next, the respondent reacts to a series of configurations and is offered two options: 1. A possibility, 2. Won’t work for me. The ACBC software then uses predictive algorithms to determine whether respondents are applying rules to accept or reject configurations (i.e. unacceptable options, must-have options). These rules are confirmed by the respondent.
Choice Tournament: The final tailored conjoint analysis is then completed by the respondent. Optimally, three different configurations are offered. Greyed out attributes represent those which are the same for each option. The exercise continues until the optimal configuration for that respondent is determined.
The power of this method lies in the multitude of benefits that come through the use of predictive models for sensing which attributes are not being used by the respondent when they make their choices, as well as the ability to calculate utilities for each respondent. This means more robust data for determining optimal feature sets, optimal pricing, product bundles that are most appealing, needs-based segmentations and more.
 |
 |
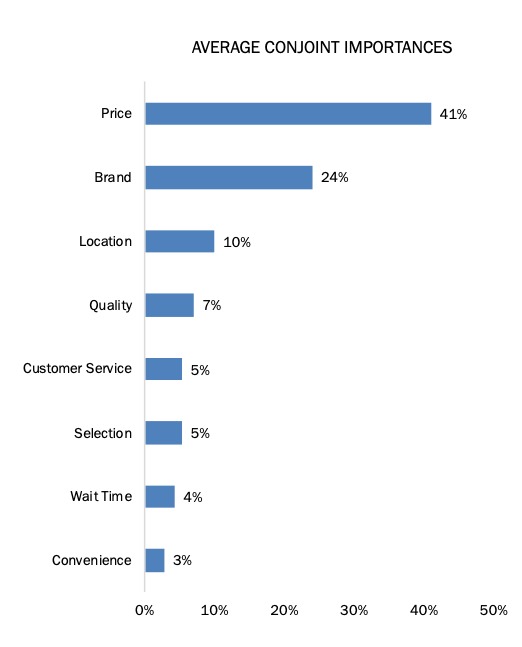 |
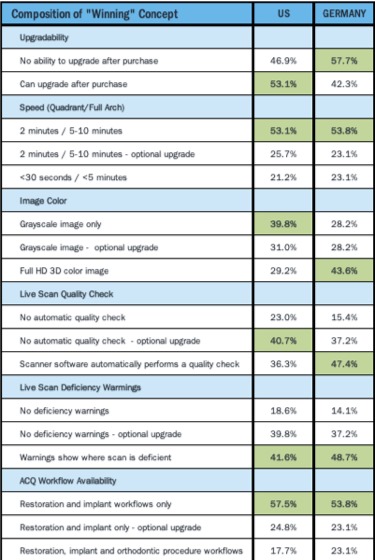
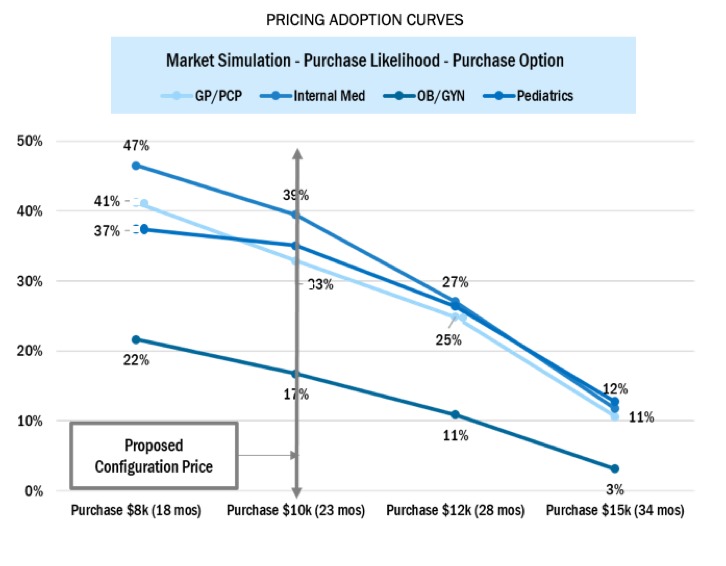
| The “Winning” Concept shows which configuration of attributes was found to be most desirable. This can be broken down to show the winning concept by segmentation. | Pricing Adoption Curves show the likely rate of adoption at a given price. This can also be broken down to show likelihood of purchase by segment. Pricing Adoption Curves | Average Conjoint Importances gives a look at the overall importance of individual attributes. Average Conjoint Importances |